


The lives of children in the UK are changing.
His height is getting smaller. Among them, more people are going hungry than a few years ago. Recently, there have been more deaths each year than a few years ago. Rising poverty, greater destitution and the effects of ongoing austerity are clearly to blame.
But why did this happen to our children? This increase in child poverty is a change that has not happened to such an extent anywhere else in the world, including where the United Nations measures it in a similar way.
Change in child poverty, 2012-14 to 2019-21

This graph tells a story of hope and success. In much of Eastern Europe, child poverty has been reduced by a third – and often by at least a quarter – in just seven years.
But it also shows that child poverty has increased the most in Britain. The poorest fifth of households in the UK are poorer than the poorest fifth of households in most of Eastern Europe. This will come as a surprise to many people in the UK. Some people will refuse to believe that it could be that bad.
Evidence of this poverty can be seen in the declining height of five-year-old children since 2010.
Average height of five-year-old boys, 1985-2020
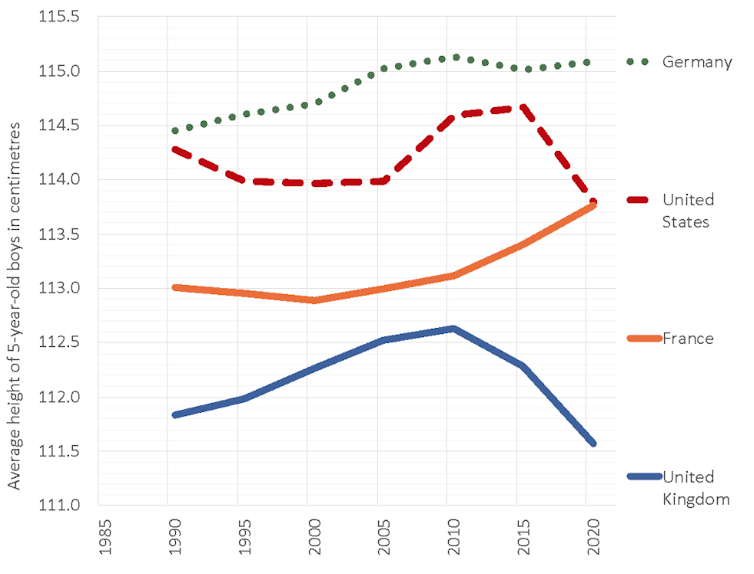
A 5-year-old child in 1990 would have been born in 1985 and his height would have been mostly influenced by nutrition in the years 1985–1990. Those were difficult years for the UK: mass poverty resulted in over three million people being thrown out of work in the early 1980s. But the average height of children was still increasing.
It was not until 2010, for children who lived between 2005 and 2010, that we saw first a plateau of heights and then a decline, coinciding with the post-2010 austerity years.
My forthcoming book seeks to understand what has happened to Britain: why, in 2024, it is not only one of the countries in Europe with the highest rates of child poverty, but the one with the highest rates above all others. Which has been selected by the United Nations. Child poverty saw the largest increase among all those surveyed.
seven children
To try to understand more about the lives of children in the UK, I created seven typical children. I divided all 14 million children living in the UK into seven groups of 2 million each according to their families’ income in 2018 and 2019. Then I picked the middle child out of each of the 2 million. I next looked at what happened to those families between 2018 and 2024.
The graph below shows the annual income of each of the seven households from which the children were taken.
Annual household income after tax, benefits and housing costs in the UK, households with children 2019/20
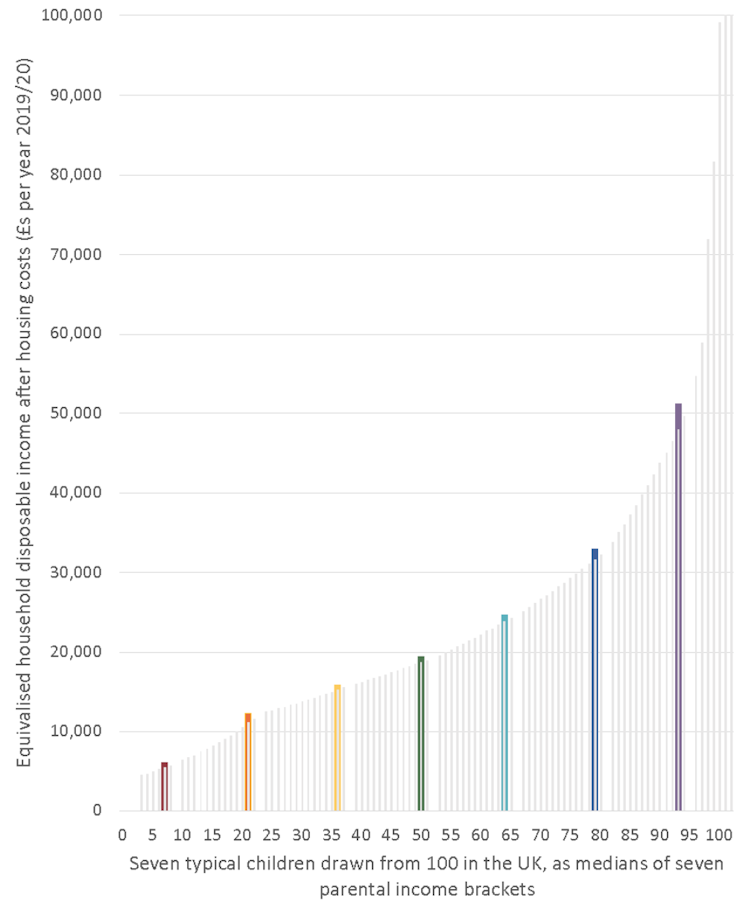
The first thing to notice is how incredibly rich those kids are, who are better off than our average seven kids.
About 6% of all children in the UK live in wealthier households than the richest typical children, according to my analysis. Those 6% of children, the fairest children of all, live in families that earn and spend a third of their entire income in the UK each year.

These 6% are not exclusive, and not the poorest 6%: they are the most destitute, whose families are most likely to use food banks. If you pick seven typical children, spread evenly across the income scale, these extremes are not part of what you see.
But four of our typical seven children now live what most affluent people would consider poverty. The other three are hardly in good condition.
The families that struggle to pay the bills and make sacrifices that others don’t even think about are the ones with the lowest levels of well-being. For example, whether it’s saving £10 a month, or insuring against the effects of flood, fire or theft. Often they are unable to afford both.
But even the most affluent of our seven children lives in a family that worries about paying annual leave. This is rare, but possible, in the most affluent twenty million families.
In 2024 the UK will show the world what it means to live with high inequality in a once prosperous country. This means that some children are having access to far more resources than most other children, such as having access to many more school teachers per child than the rest of the children, better food, better shelter, more warmth, more toys, Better content. Everything; Often any child needs more than you think.
In the future, almost all of our children will tell their stories of growing up in the UK in the 2020s and – hopefully – what changed to make things better. It’s hard to imagine that they’ll get any worse.![]()
,Author: Danny Dorling, Halford Mackinder, Professor of Geography, University of Oxford)
,disclosure statement: Danny Dorling does not work for, consult to, own shares in, or receive funding from any company or organization that would benefit from this article, and he has disclosed no relevant affiliations beyond his academic appointment. haven’t done)
This article is republished from The Conversation under a Creative Commons license. Read the original article.
(Except for the headline, this story has not been edited by NDTV staff and is published from a syndicated feed.)